(Much of the material adapted from notes from Easterbrook and Neves)
https://colab.research.google.com/drive/1aFcVpTxy5XzfMx2toB7VRJOLW8uBAZQg?usp=sharing
Measurements
| Type | Meaning | Operations |
|---|---|---|
| Nominal | Unordered classification of objects | = |
| Ordinal | Ranking of objects into ordered categories | =, <, > |
| Interval | Differences between points on a scale is meaningful | =, <, >, -, $\mu$ |
| Ratio | Ratio between points on a scale is meaningful | =, <, >, -, $\mu$, ÷ |
| Absolute | No units are necessary, scale is just the scale | =, <, >, -, $\mu$, ÷ |
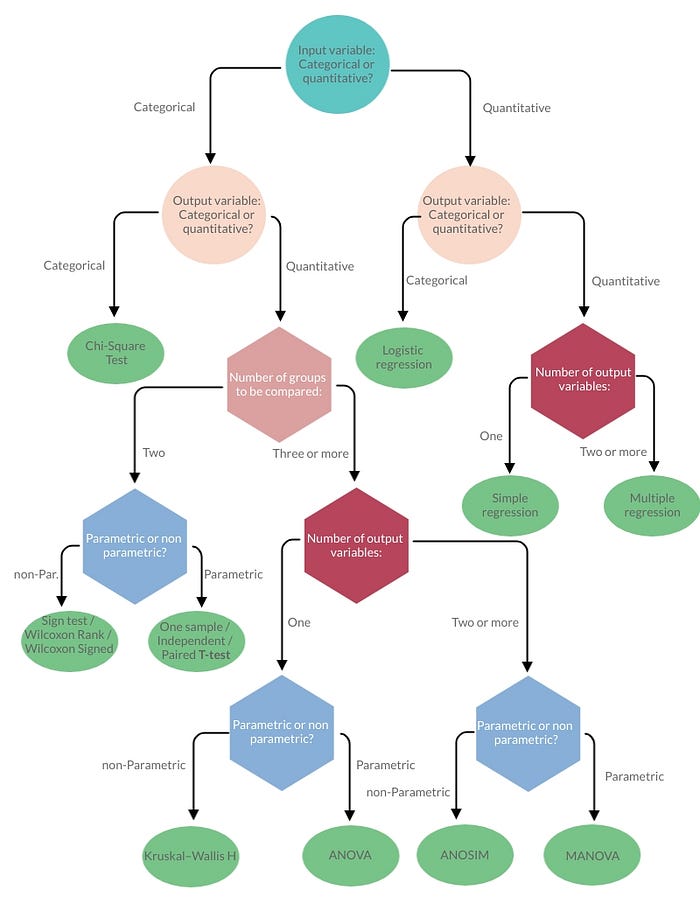
Statistical Tests
Back to Basics
Relationships between two variables:
- Magnitude – how strong is the relationship?
- Reliability – how well does the relationship in the sample represent the relationship in the population?
Strong relationships can be detected more reliably
Larger sample sizes produce more reliable results
Hypothesis Testing
Set up some hypotheses:
Null hypothesis ($𝐻_0$): asserts that a relationship does not hold
In many cases, this is the same as saying there is no difference in the the means of two different treatment groups
Alternative hypotheses ($𝐻_1$, …): each asserts a specific relationship
Type I error: A false positive (rejecting $𝐻_0$ when it’s true)
Type II error: A false negative (accepting $𝐻_0$ when it’s false)
For the statistical tests
p-value (we calculate this): probability that a relationship observed in the sample happened by chance
$\alpha$ level (selected a priori): a threshold for p at which we will accept that a relationship did not happen by chance (typically 0.1 or 0.05)
This allows us to fix the probability of a type I error in advance
if p < $\alpha$, we say the result was significant
Data Distributions
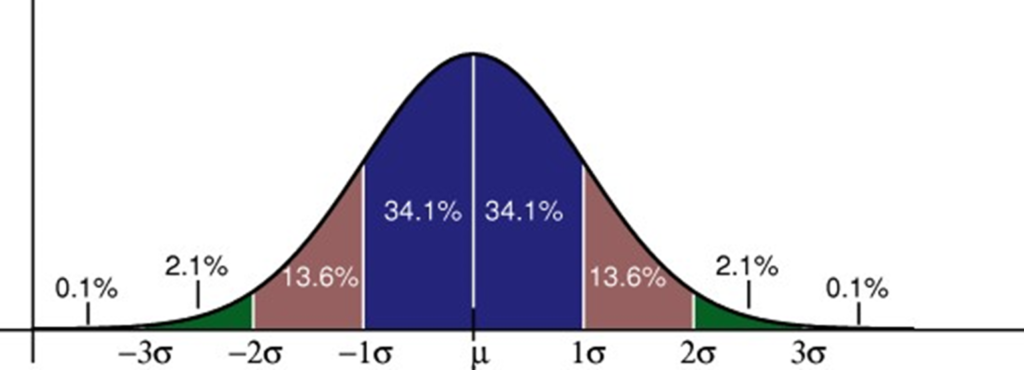
All measurements are represented by distributions.
Normal Distribution is one such distribution:
How do we know if the data is normal?
This is a very very important question that you must answer before you can do a statistical test.
Tests of Normality
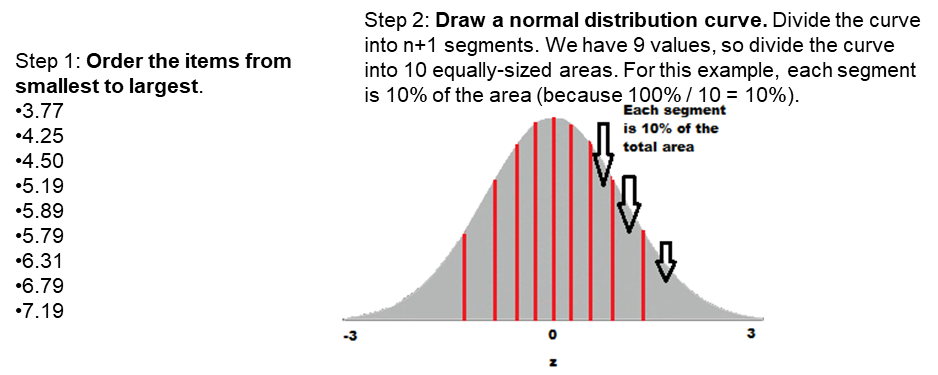
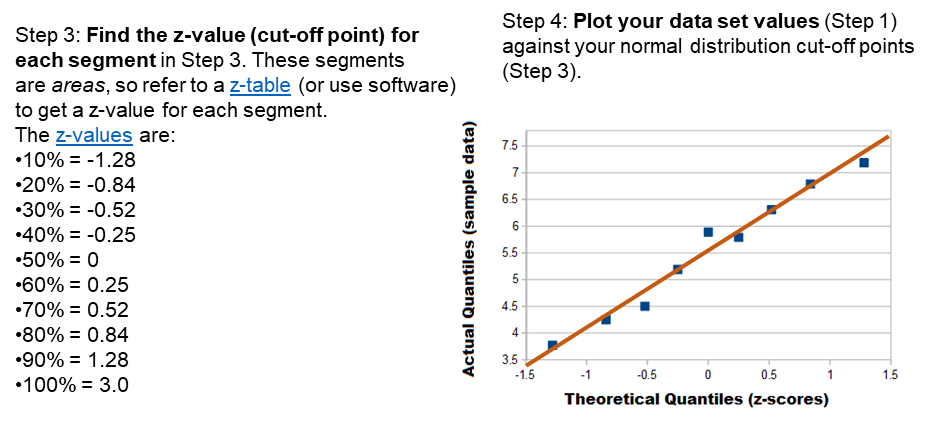
Q-Q Plot
Shapiro-Wilk Test
How far off is the Q-Q plot from actual normal data? Provides an Effect Size (W) and a p-value.
Kolmogorov-Smirnov Test
Tests Empirical Cumulative Distribution Functions (ECDFs).
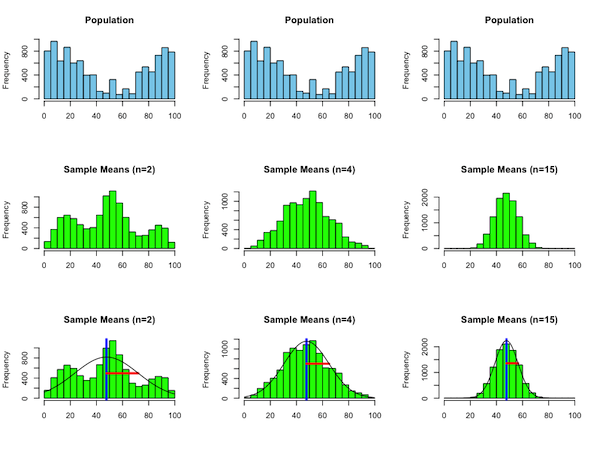
Central Limit Theorem
So maybe your distribution isn’t a normal distribution.
However, if you take a sample of that distribution and compute its mean, and then do that many times, the distribution of means will always be a normal distribution.
Student’s T-Test
For testing whether two samples really are different
Given: two experimental treatments, one dependent variable
Assumes:
- the variables are normally distributed in each treatment
- the variances for the treatments are similar
- the sample sizes for the treatments do not differ hugely
Basis: difference between the means of samples from two normal distributions is itself normally distributed.
The t-test checks whether the treatments are significantly different
Procedure:
$H_0$: There is no difference in the population means from which the samples are drawn
Choose a significance level (e.g. 0.05)
Calculate $t$ as
$t = \frac{\hat{x}-\hat{y}}{\sqrt{((SE_x)^2+ (SE_y)^2)}}$
where
$SE = \frac{\sigma}{n}$
Variants:
One-sided/two-sided
Independent/Paired
Correlation
Measure of the relation between two variables:
-1 variables perfect inverses (negative correlation)
0 no correlation at all
+1 variables are perfectly correlated (they appear on a straight line with positive slope)
Pearson’s $R$:
$\hat{x}$ and $\hat{y}$ are sample means (therefore assumes normality)
$s_x$ and $s_y$ are standard deviations
$𝑛$ is the sample size
$r_{x,y}=\frac{\sum{(x_i-\hat{x})(y_i-\hat{y})}}{(n-1) s_x s_y}$